

Transaction Control
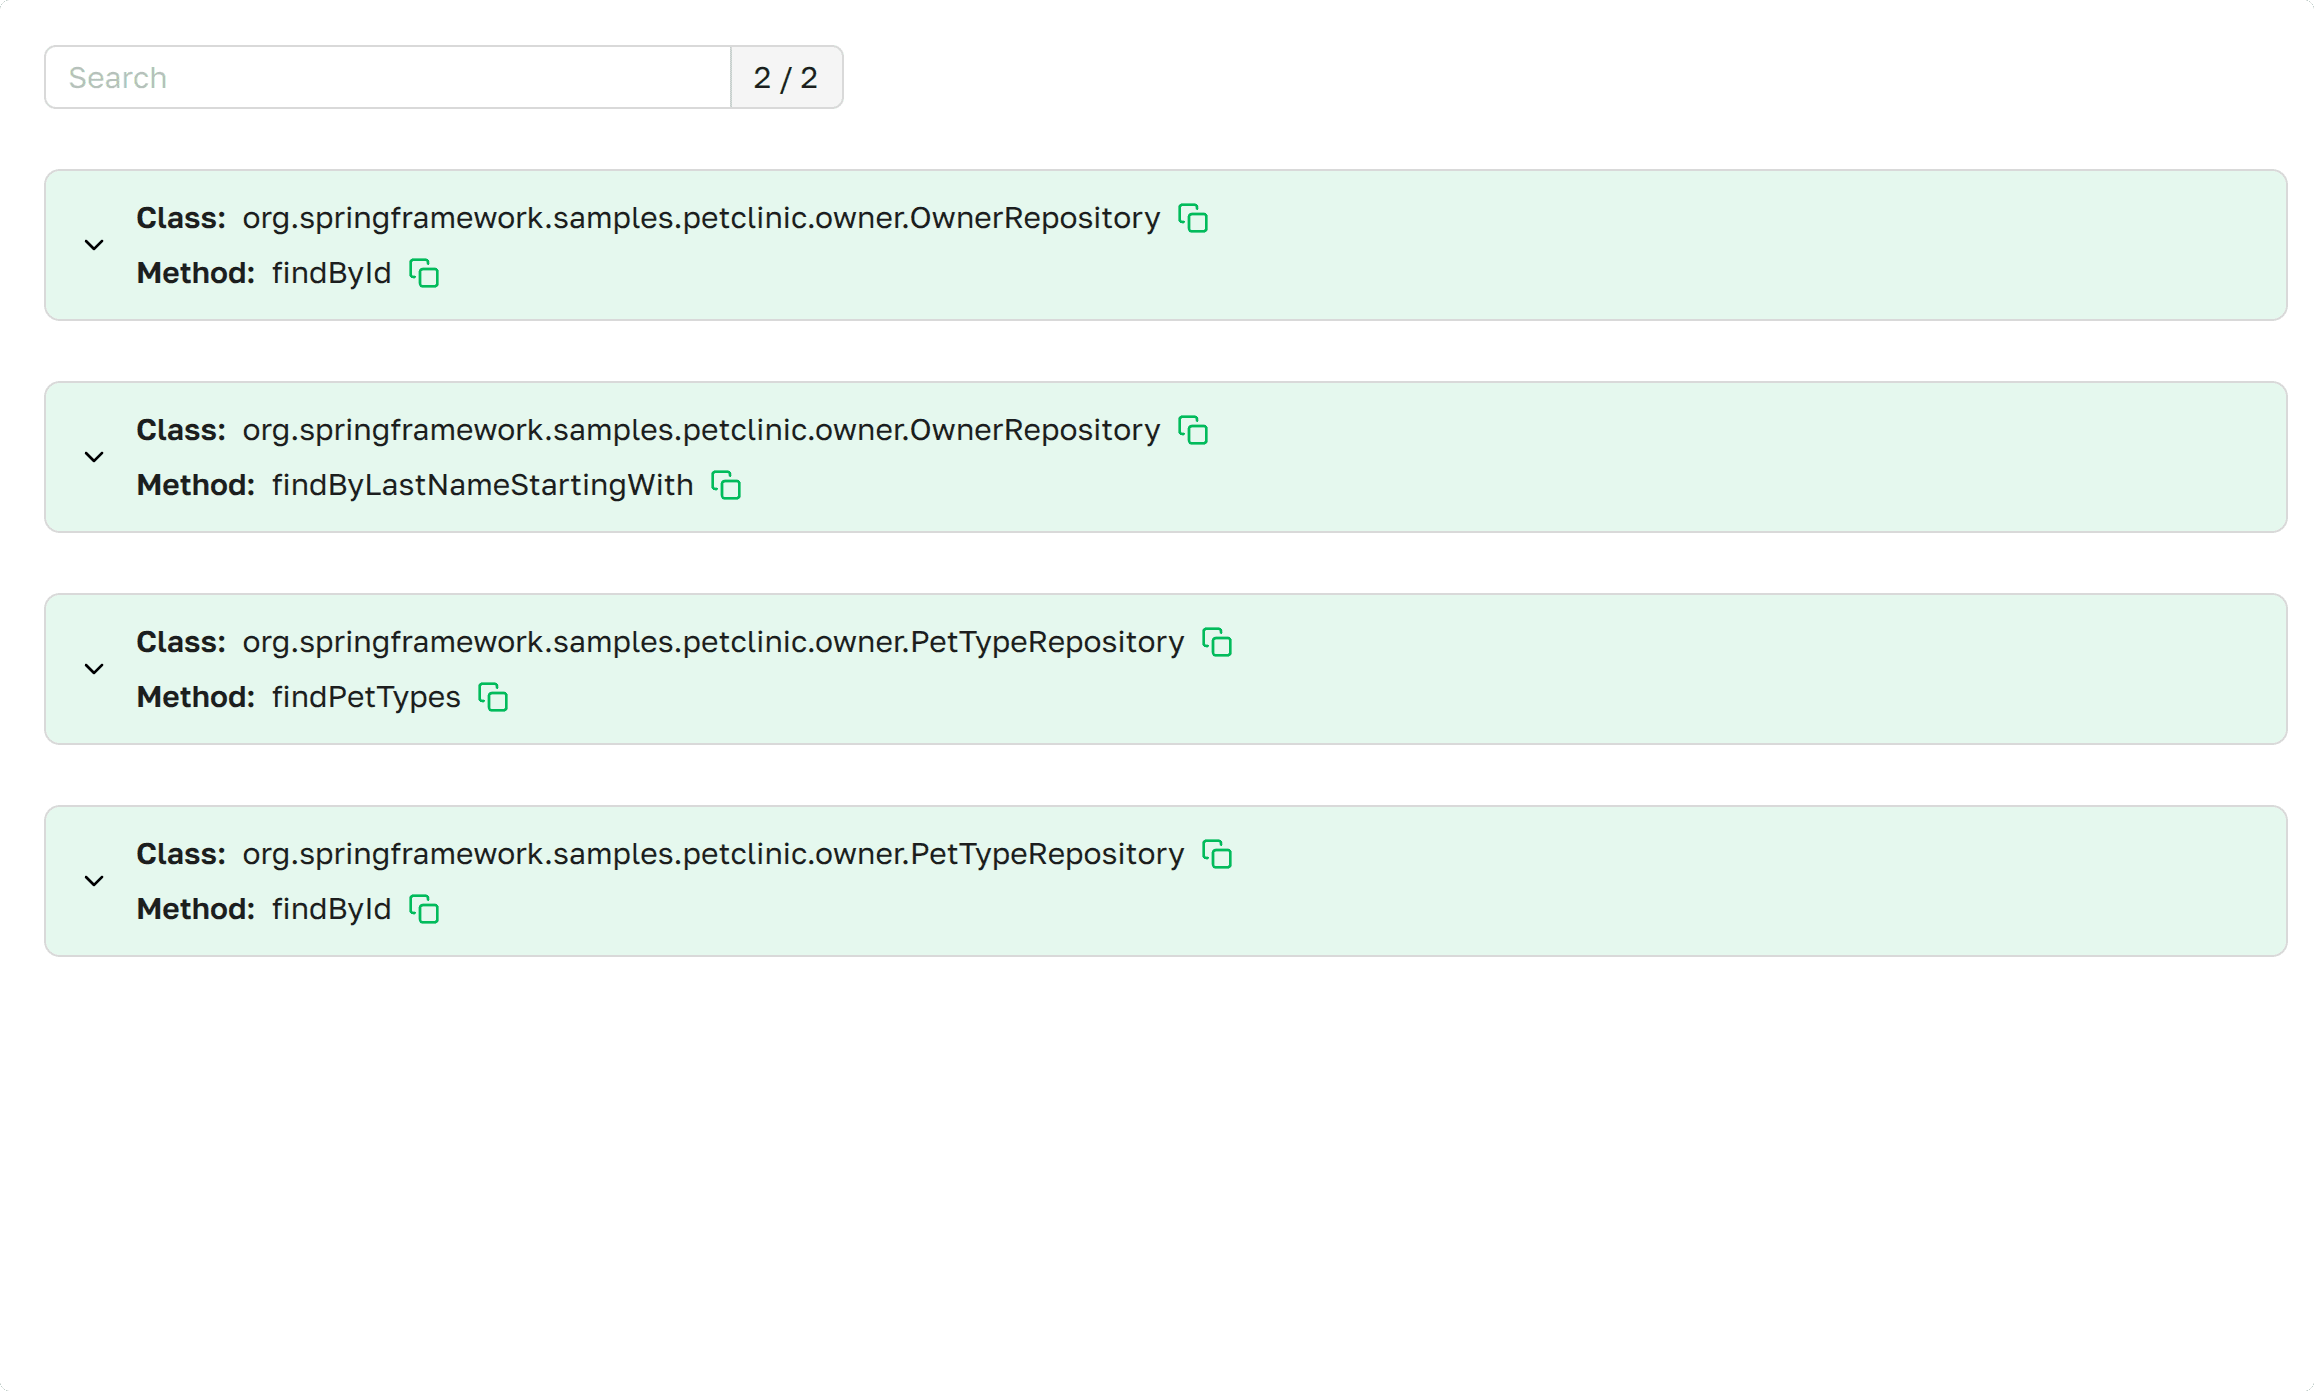
The Transaction Control page lists every @Transactional method the managed Spring Boot instance has executed at least once, with execution timings and the SQL queries run inside each invocation. Use it to spot slow transactions and inspect the queries they issued.
 Transaction Control
as presented in Axelix UI
Transaction Control
as presented in Axelix UI
The page is read-only and available to every authenticated user — VIEWER, EDITOR, ADMIN, and SUPER_ADMIN can all open it. See Roles and authorities for the full role/authority matrix.
A scrollable list of every transactional entry point the instance has seen, with a search input above the list and a
counter in the form <matching> / <total>. Each row is an accordion, its header shows:
- Class: the fully qualified class declaring the
@Transactionalmethod. - Method: the name of the
@Transactionalmethod.
Execution chart
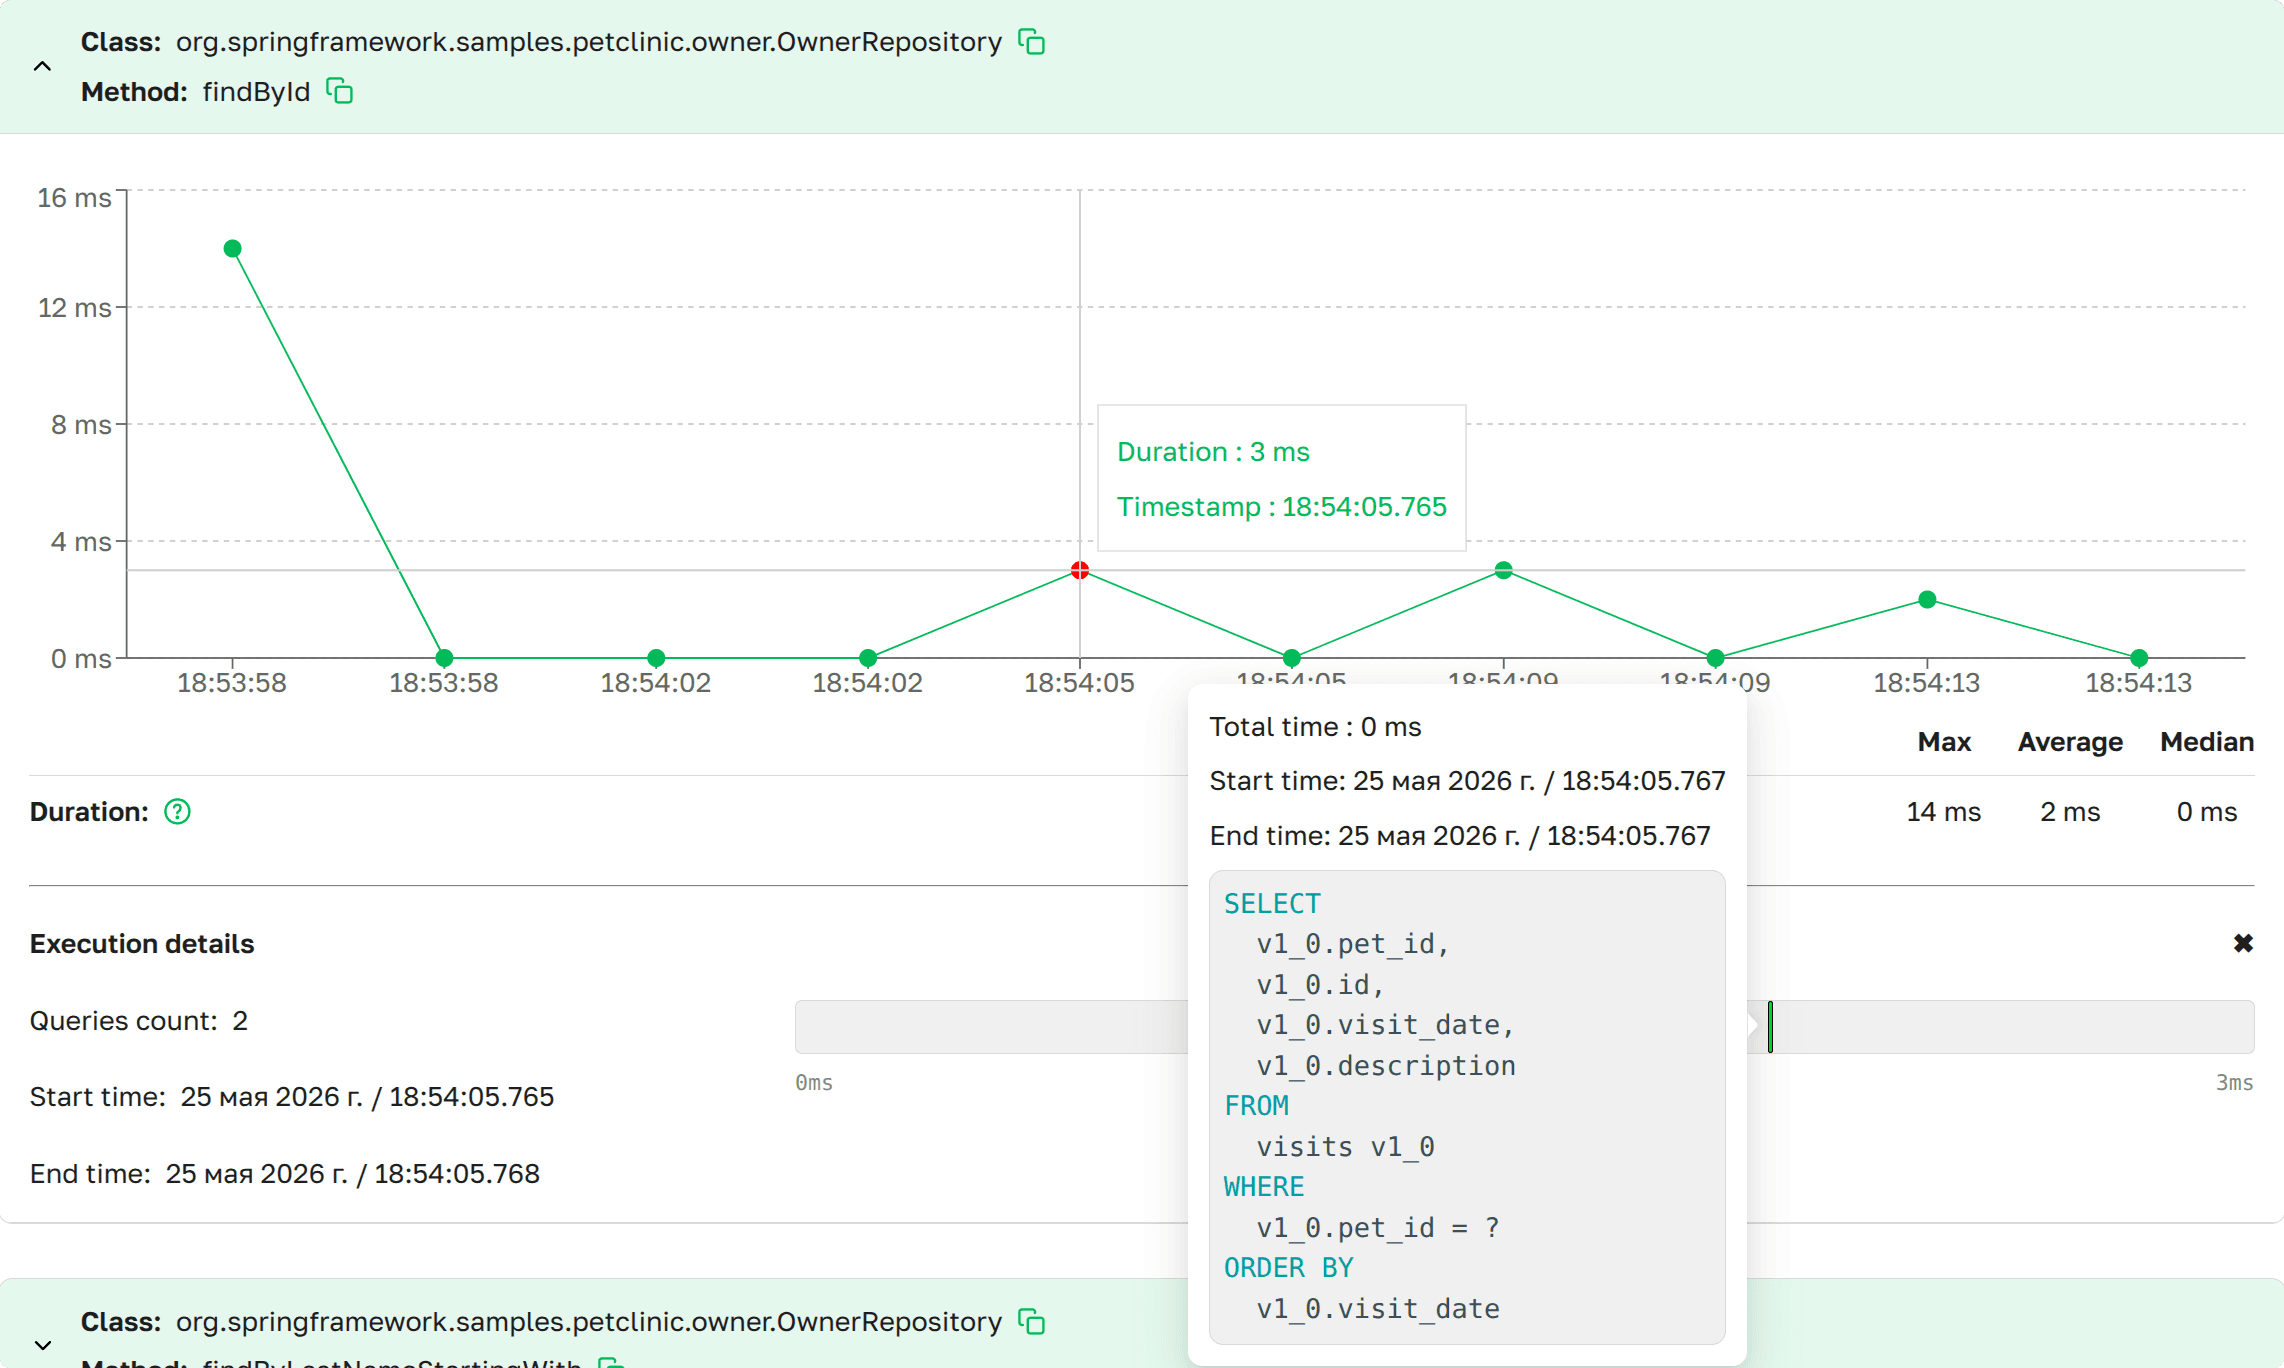
Expanding a row reveals a scatter chart of every recorded execution of that method.
 Transaction details as
presented in Axelix UI
Transaction details as
presented in Axelix UI
- X axis — the start time of each execution.
- Y axis — the execution duration in milliseconds.
- Hovering a point shows the Timestamp and Duration of that execution.
- Clicking a point opens the Execution details panel for that run.
Below the chart, the Duration row summarises all recorded executions of this method:
- Max — the longest execution duration in milliseconds.
- Average — the arithmetic mean in milliseconds.
- Median — the median in milliseconds.
Execution details
Clicking any point on the chart opens a side panel with the chosen execution's detail.
- Queries count — number of JDBC queries this execution issued. If the count is zero, a warning icon is shown.
- Start time — when the
@Transactionalmethod was entered and the transaction began, captured on the monitored JVM in millisecond precision. - End time — when the
@Transactionalmethod returned and the transaction was committed or rolled back, captured on the monitored JVM in millisecond precision. The difference between End time and Start time equals the Duration value shown for this point on the chart. - Queries timeline — a horizontal bar for each query, laid out against the execution's timeline so you can see which query ran when and for how long. Each bar exposes a preview of the SQL statement on hover.
How this data is collected: the starter wraps @Transactional proxies with a monitoring interceptor and the
application's DataSource with a query-recording proxy, so timings and SQL are captured on the JVM at runtime — no
agent or APM tool is required.
Properties
The page is not backed by a dedicated actuator endpoint. The Axelix Spring Boot Starter aggregates the transaction
insights on the JVM and ships them to Master as part of the instance's registration metadata — the same payload
exposed through the axelix-metadata endpoint that Master already probes. As long as axelix-metadata is exposed (see
Configuring Spring Boot
Starter), this page works
with no extra endpoint to enable.
Transaction monitoring is enabled by default. To turn it off entirely, set
axelix.sbs.transaction.monitoring.enabled=false — see Transaction
monitoring
for details.