

Metrics
The Metrics page lists every Micrometer meter exposed by a managed Spring Boot instance, with a live chart and tag filtering per metric.
Metrics are automatically grouped by their prefixes into expandable dropdown sections. Each group represents a logical category of related metrics, such as JVM, HTTP, or JDBC. This organization helps you quickly find and analyze metrics that belong to the same functional area.
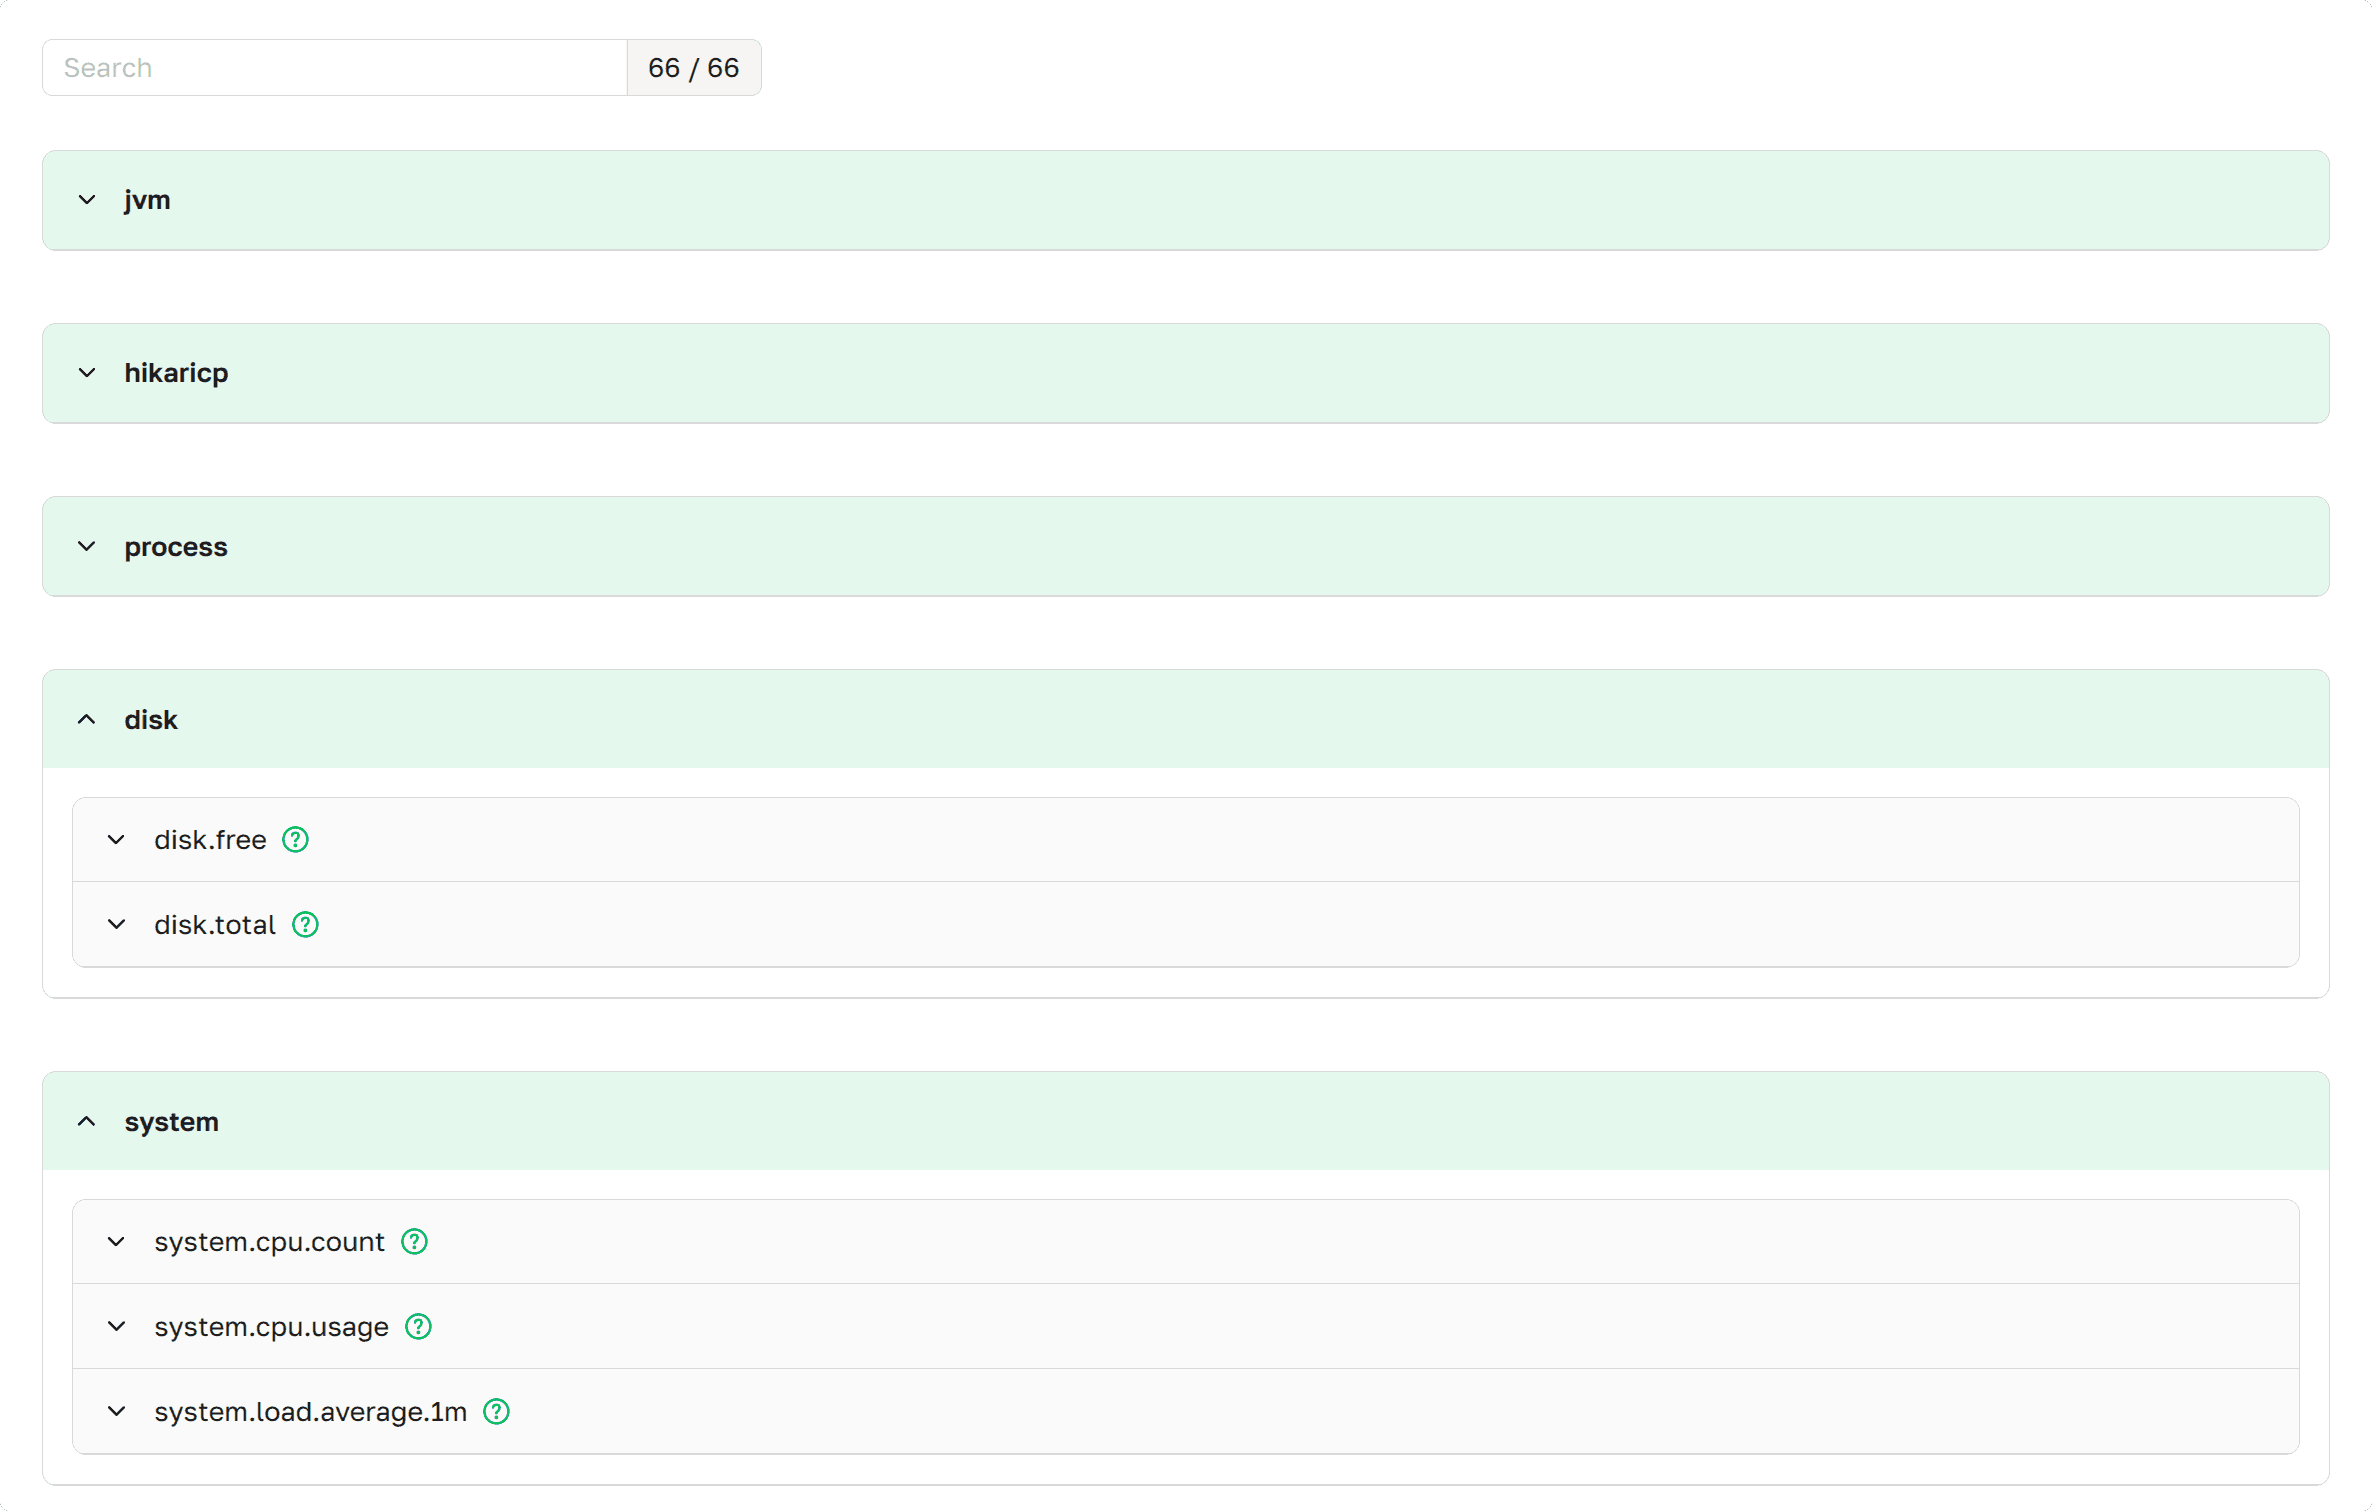 Metrics as presented in Axelix UI
The page is read-only and available to every authenticated user — VIEWER, EDITOR, ADMIN, and SUPER_ADMIN can all open it. See Roles and authorities for the full role/authority matrix.
Axelix-published meters
Besides showing the meters your application already exposes, Axelix can also contribute its own Micrometer meters. This
happens when you use axelix-spring-boot-X-starter (i.e. Axelix starter) and the application already has a MeterRegistry bean.
If MeterRegistry is registered, Axelix will contribute the following meters to the registry:
axelix_transaction_duration—Timertagged byclassandmethod.axelix_transaction_queries—Countertagged byclassandmethod.axelix_transaction_external_calls—Countertagged byclassandmethod.axelix_cache_requests—Countertagged bycacheandresult=hit|miss.axelix_cache_enabled—Gaugetagged bycache, reporting1for enabled and0for disabled caches.
The /actuator/prometheus endpoint will also expose those metrics (if prometheus actuator endpoint if enabled, of course). It means,
that you can use them to build your own custom dashboards in various systems, such as Grafana, for example.
You can find more details about each metric on the corresponding page.
Metric Details
The Metric Details page provides in-depth analysis of individual metrics with interactive charts, real-time values, and intelligent tag filtering capabilities.
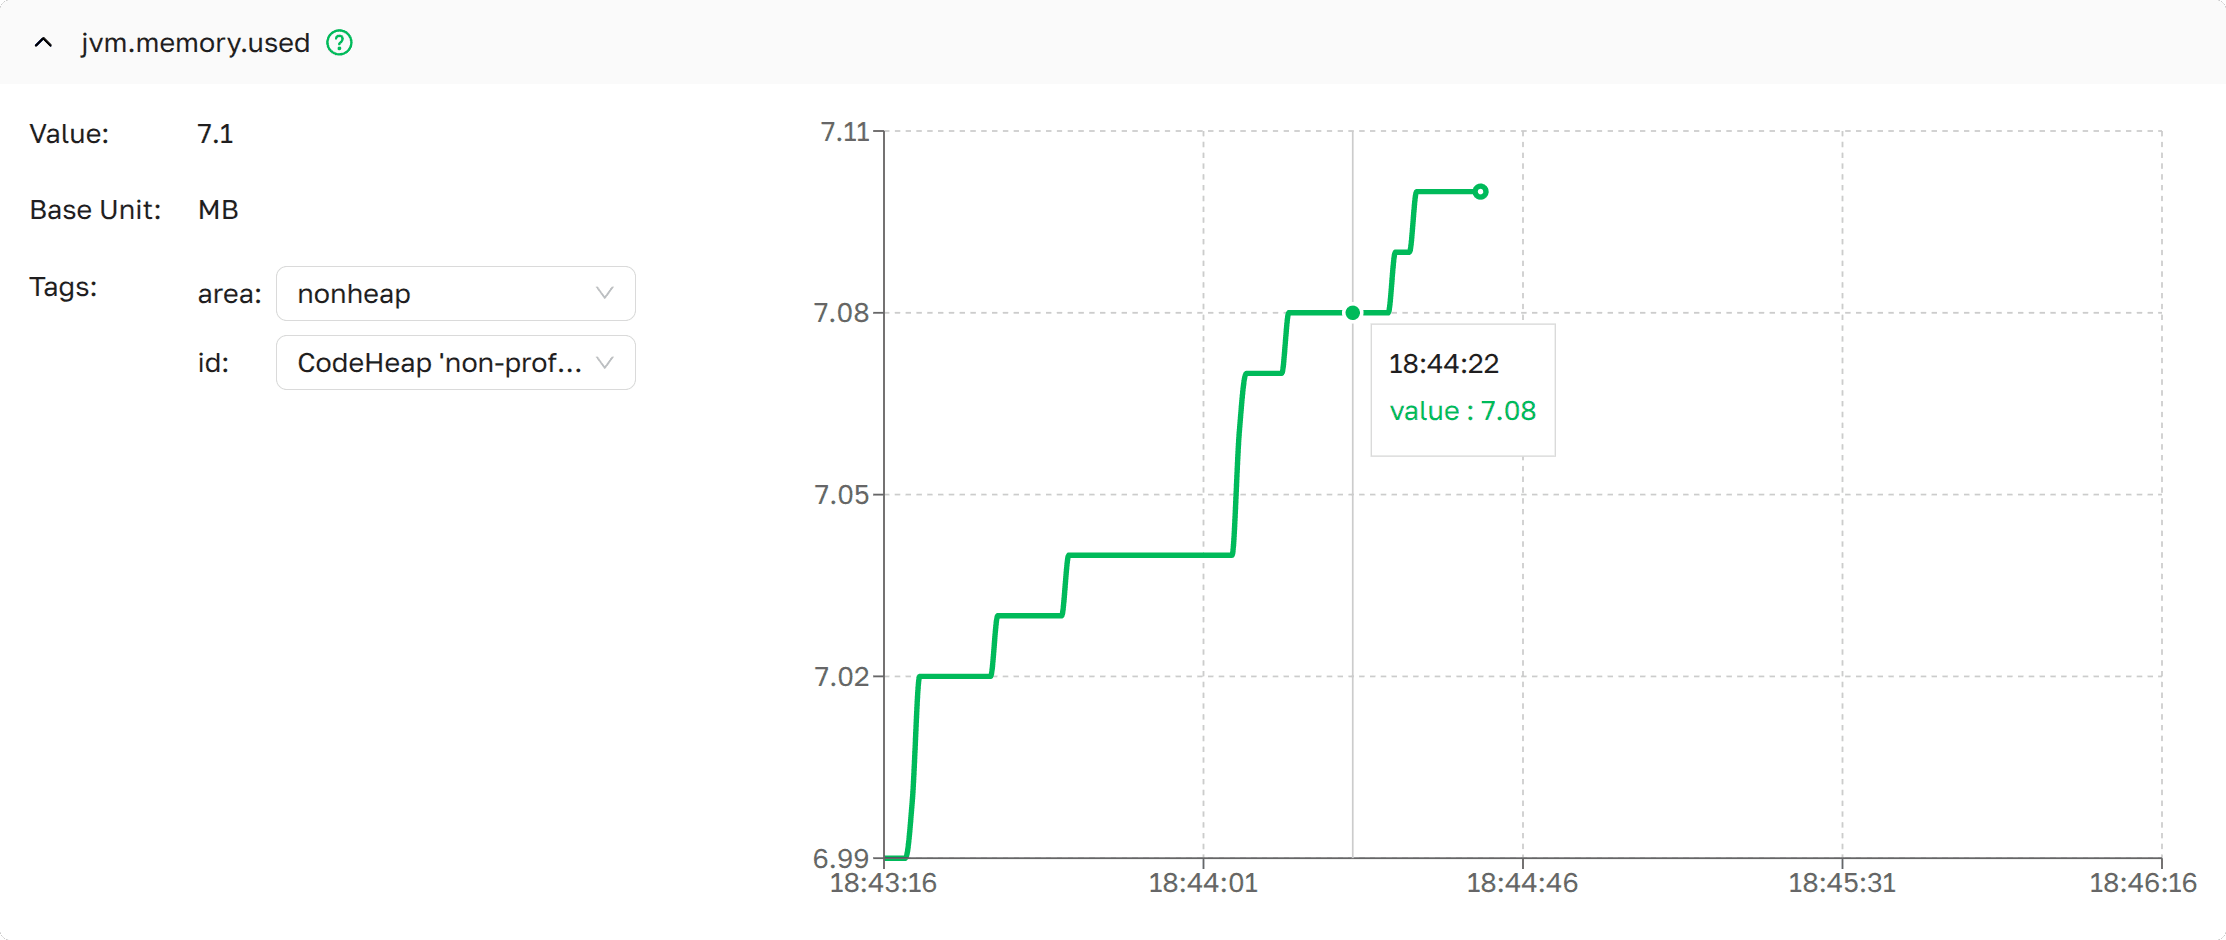 JVM Memory Metric details as
presented in Axelix UI
JVM Memory Metric details as
presented in Axelix UI
Page Layout
Dropdown Header
- Metric Name: Full metric identifier (e.g.,
jvm.memory.max) - Description: Hover your cursor over the icon
 to see what this metric measures.
Left Panel: Current Metric Information
Displays real-time information about the selected metric:
- Value: Latest measurement
- Base Unit: Measurement unit (bytes, milliseconds, percentage, scalar quantity etc.)
- Tags: Dropdown selectors for filtering measurements by tag dimensions. Only combinations that actually exist on the instance are offered, invalid combinations are kept visible but disabled.
Right Panel: Time Series Chart
Line chart of the metric value over a sliding time window. The page polls the instance periodically and resets the window once it elapses, so the chart reflects recent behaviour rather than the full history since the instance started.
Tag Filtering (Drilling Down)
The list of valid tag combinations comes from the instance's Micrometer MeterRegistry — Axelix does not invent or
constrain them. When you pick a value in one dropdown, the others update to show only the still-valid options; invalid
ones stay visible but disabled, with the tooltip "This tag value is not valid, considering the values selected for
other tags". See the Spring Boot reference for the underlying mechanic: Drilling
Down.
How It Works
When you select a tag value, the available options for the remaining tags are filtered down to the combinations that actually exist on the running instance.
Example: JVM Memory Metrics
For metric jvm.memory.used with tags area and id:
area | id | Offered |
|---|---|---|
| heap | G1 Eden Space | ✅ |
| heap | G1 Survivor Space | ✅ |
| heap | G1 Old Gen | ✅ |
| nonheap | Metaspace | ✅ |
| nonheap | Compressed Class Space | ✅ |
| nonheap | CodeHeap profiled nmethods | ✅ |
| nonheap | CodeHeap non-nmethods | ✅ |
| nonheap | CodeHeap nonprofiled-nmethods | ✅ |
| heap | Metaspace | ❌ |
| nonheap | G1 Old Gen | ❌ |
Enable Dedicated Actuator Endpoint
If you are on Axelix 1.2.0 or later, none of this is required: the starter registers its custom actuator endpoints by itself, and Axelix no longer requires the health/info endpoints to be enabled — it works perfectly well without them. No configuration is needed here.
The page is backed by the axelix-metrics actuator endpoint contributed by the Axelix Spring Boot Starter. Expose it
through the standard Spring Boot Actuator properties — see Configuring Spring Boot
Starter for the full list
of Axelix endpoints and surrounding setup:
management.endpoints.web.exposure.include=axelix-metrics